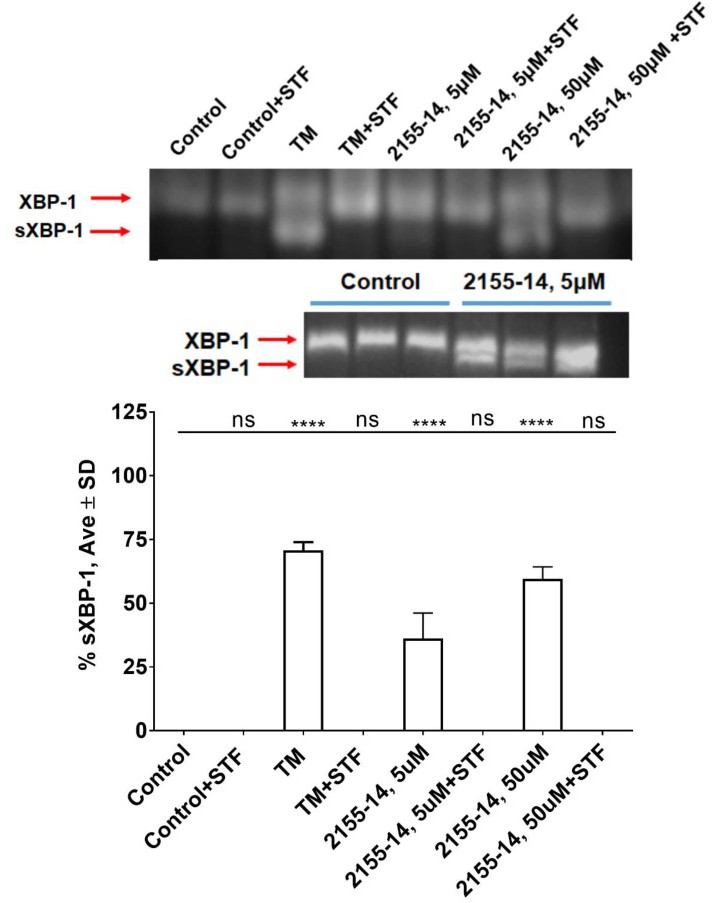
Fig. 5. RNA blot analysis of ER stress marker sXBP-1 in WM266-4 cells confirms that 2155-14 induces ER stress. Representative blot and quantification 2 h after addition of 5 µM and 50 µM 2155-14 to WM266-4 cells. % sXBP-1 was calculated as a % of total XBP-1 (total XBP-1 = sXBP-1 (lower band) + XBP-1 (upper band)). sXBP-1 band in 5 µM 2155-14 lane was confirmed by running additional replicates (lower blot). 5 μg/mL tunicamycin (TM) used as a positive control. STF - 60 μM STF-83010, an inhibitor of IRE1 RNase activity responsible for splicing of XBP1 into ER stress marker sXBP1. One-way analysis of variance (ANOVA) was used followed by Dunnett post hoc test. The data shown were the mean ± SD, n=3. **** - p<0.0001, ns - no significance.